
دانلود رایگان مقاله برآوردشوری سطح دریا با استفاده از سنسور های رادیومتری ماهواره ای
برآورد شوری سطح دریا
نویسندگان مقاله: N.Reula,S.A.Grodskym,and others
سال انتشار : ۲۰۲۰
تعداد صفحات : ۳۷ صفحه
فرمت فایل: PDF
زبان مقاله : انگلیسی
عنوان مقاله به انگلیسی : Sea surface salinity estimates from spaceborne L-band radiometers: An overview of the first decade of observation (2010–۲۰۱۹)
چکیده فارسی:( ترجمه گوگل)
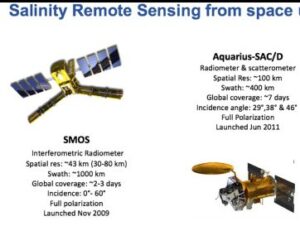
مأموریت ماهواره ای رطوبت خاک و شوری اقیانوس (SMOS) توسط آژانس فضایی اروپا (ESA) از اواخر سال ۲۰۰۹ به بهره برداری رسیده است ، اولین رادیومتر که در مدار است به مشاهدات و جمع آوری منظم داده های جهانی از دو متغیر اساسی آب و هوایی سیستم جهانی اقدام می کند: سطح شوری دریا (SSS) و رطوبت خاک. مأموریت ملی هوانوردی و فضایی (ناسا) ، با هدف اصلی ارائه اندازه گیری SSS جهانی از فضا که از اواسط سال ۲۰۱۱ تا اواسط ۲۰۱۵ انجام شده است. مأموریت اصلی Moisture Active-Passive (SMAP) ناسا که عمدتا به اندازه گیری رطوبت خاک اختصاص داده شده و مانیتورینگ SSS هم انجام می دهد ، از اوایل سال ۲۰۱۵ فعالیت می کند. سنسورهای اصلی موجود در این سه ماموریت رادیومترهای مایکروویو منفعل هستند که با سرعت ۱٫۴ گیگاهرتز کار می کنند (باند L) .
SSS که از اندازه گیری رادیومتر دمای روشنایی سطح دریا (TB) بازیابی می شود. در این مقاله ، ابتدا یک بررسی تاریخی از سنجش از دور SSS با رادیومتری باند منفعل آغاز و سپس به بحث در مورد اصول اندازه گیری ، فناوری ، ویژگی های سنجش و مکمل های سه ماموریت فوق الذکر پرداخته می شود. سپس ارزیابی محصولات SSS ماهواره ای از نظر ویژگی های ماموریت فردی ، الگوریتم های مشترک و عدم قطعیت های اندازه گیری ، از جمله اعتبارسنجی در مقابل داده های درجا ، و بررسی تفاوت های نمونه برداری بین SSS ماهواره ای و اندازه گیری شوری درجا مطرح میشود. در ادامه به دستاوردهای مهم علمی حاصل از ۱۰ سال اول بررسی داده های SSS ماهواره ای ترکیبی ، از جمله بینش های فعال شده توسط این اندازه گیری ها در مورد پیوند SSS با چرخه آب جهانی ، تغییرپذیری آب و هوا و بیوشیمی اقیانوس را مورد بحث قرار خواهیم داد. ما همچنین توانایی جدیدی را که ماهواره ها برای نظارت بر ویژگی های SSS در مقیاس متوسط و سینوپتیک ارائه می دهند و درک ما از نقش SSS در تعامل هوا و دریا ، محدود کردن مدل های اقیانوس و بهبود پیش بینی های فصلی را برجسته می کنیم. مروری بر نکات برجسته مشاهده SSS ماهواره ای در این دهه اول و چالش های آینده ارائه شده است.
Abstract
Operated since the end of 2009, the European Space Agency (ESA) Soil Moisture and Ocean Salinity (SMOS) satellite mission is the first orbiting radiometer that collects regular and global observations from space of two Essential Climate Variables of the Global Climate Observing System: Sea Surface Salinity (SSS) and Soil Moisture. The National Aeronautics and Space Administration (NASA) Aquarius mission, with the primary objective to provide global SSS measurements from space operated from mid-2011 to mid-2015. NASA’s Soil Moisture Active-Passive (SMAP) mission, primarily dedicated to soil moisture measurements, but also monitoring SSS, has been operating since early 2015. The primary sensors onboard these three missions are passive microwave radiometers operating at 1.4 GHz (L-band). SSS is retrieved from radiometer measurements of the sea surface brightness temperature (TB).
In this paper, we first provide a historical review of SSS remote sensing with passive L-band radiometry beginning with the discussions of measurement principles, technology, sensing characteristics and complementarities of the three aforementioned missions. The assessment of satellite SSS products is then presented in terms of individual mission characteristics, common algorithms, and measurement uncertainties, including the validation versus in situ data, and, the consideration of sampling differences between satellite SSS and in situ salinity measurements. We next review the major scientific achievements of the combined first 10 years of satellite SSS data, including the insights enabled by these measurements regarding the linkages of SSS with the global water cycle, climate variability, and ocean biochemistry. We also highlight the new ability provided by satellites to monitor mesoscale and synoptic-scale SSS features and to advance our understanding of SSS’ role in air-sea interactions, constraining ocean models, and improving seasonal predictions. An overview of satellite SSS observation highlights during this first decade and upcoming challenges are then presented.
Sea surface salinityOcean microwave remote sensingRadiometerL-bandSMOSAquarius/SAC-DSMAP

Download : Download high-res image (500KB)
Download : Download full-size image
Fig. 1. (Left) Number of historical in situ SSS observations over 125 years from 1874 to 1998 per 1° square (from Bingham et al., 2002). Note that only few WOCE lines were available into the NODC database used to build the density map (personal exchanges with F. Bingham). (Right) Number of historical in situ SSS observations per 1° square during the first 9 years of the satellite salinity era from 2010 to 2018. Blue, >10 observations; green, >100 observations; and red, >1000 observations. No color means <10 observations. (For interpretation of the references to color in this figure legend, the reader is referred to the web version of this article.)
Despite its oceanographic importance, SSS is an ocean ECV that only started to be estimated from space about ten years ago (Fig. 2) with the launch of the Soil Moisture and Ocean Salinity (SMOS) mission by the European Space Agency (ESA) in November 2009. The SMOS mission was then followed by the NASA/CONAE Aquarius/SAC-D mission also focused on the sea surface salinity. Both missions had an overlapping period between June 2011 and mid-2015. Next came the NASA Soil Moisture Active-Passive (SMAP) mission launched in early 2015, which also monitors SSS. SMOS and SMAP operation periods overlapped with Aquarius only during about four months (February to June 2015). The primary sensors onboard these three missions are L-band microwave radiometers operating at ~1.4 GHz (wavelength = ۲۱ cm).

Download : Download high-res image (252KB)
Download : Download full-size image
Fig. 2. Overview of the timeline of satellite salinity missions.

Fig. 3.(a) sensitivity of the ocean surface microwave brightness temperature to Salinity(First Stokes parameter)as a function of electromagnetic frequency and incidence angle and for a water body with salinity of 35 pss and temperature of 15 °C.(b)Brightness temperature changes at 1.4 GHz and nadir as a function of salinity (x-axis) and temperature (colors).
برای دانلود رایگان و مطالعه کامل مقاله می توانید بر روی لینک ذیل کلیک نمایید: (رمز دانلود فایل: ۹۰۲۶)
[maxbutton id=”14″ ]
توجه مهم!
این فایل توسط سایت اینویروساینس تهیه شده و فروش آن در سایر سایت ها و فروشگاه های فایل با هر نامی شرعا و قانونا مجاز نبوده و پیگیری خواهد شد.
 دریافت مطالب جدید و کدهای تخفیف ویژه اعضاء با عضویت در کانال تلگرام: @enviroscience_ir
برای ارتباط با پشتیبان سایت اینجا کلیک کنید: تماس با پشتیبان
مطالب زیر را حتما مطالعه کنید

اثرات سموم کشاورزی بر روی زنان باردار

آموزش کشت قارچ دکمه ای درخانه

در مورد حیوانات تراریخته چه میدانیم؟
دیدگاهتان را بنویسید
برای نوشتن دیدگاه باید وارد بشوید.